Resources
While the Dashboard gives you a snapshot of right now, the Resources page gives you context. It displays historical time-series charts that track the last 60 seconds of system activity, updated every second. This makes it easy to spot trends, correlate events, and catch brief spikes that disappear before you can glance at a single-number gauge.
How the Charts Work
Every chart on the Resources page follows the same design:
- 60-second sliding window — the chart always shows the most recent minute of data, scrolling continuously from right to left.
- 1-second refresh — data points are sampled once per second (with one exception noted below).
- Dynamic Y-axis — the vertical scale adjusts automatically so you always see the full range of values without wasted whitespace.
- Per-metric color coding — each metric has a consistent color that matches the Dashboard tiles, making it easy to associate charts with the rest of the interface.
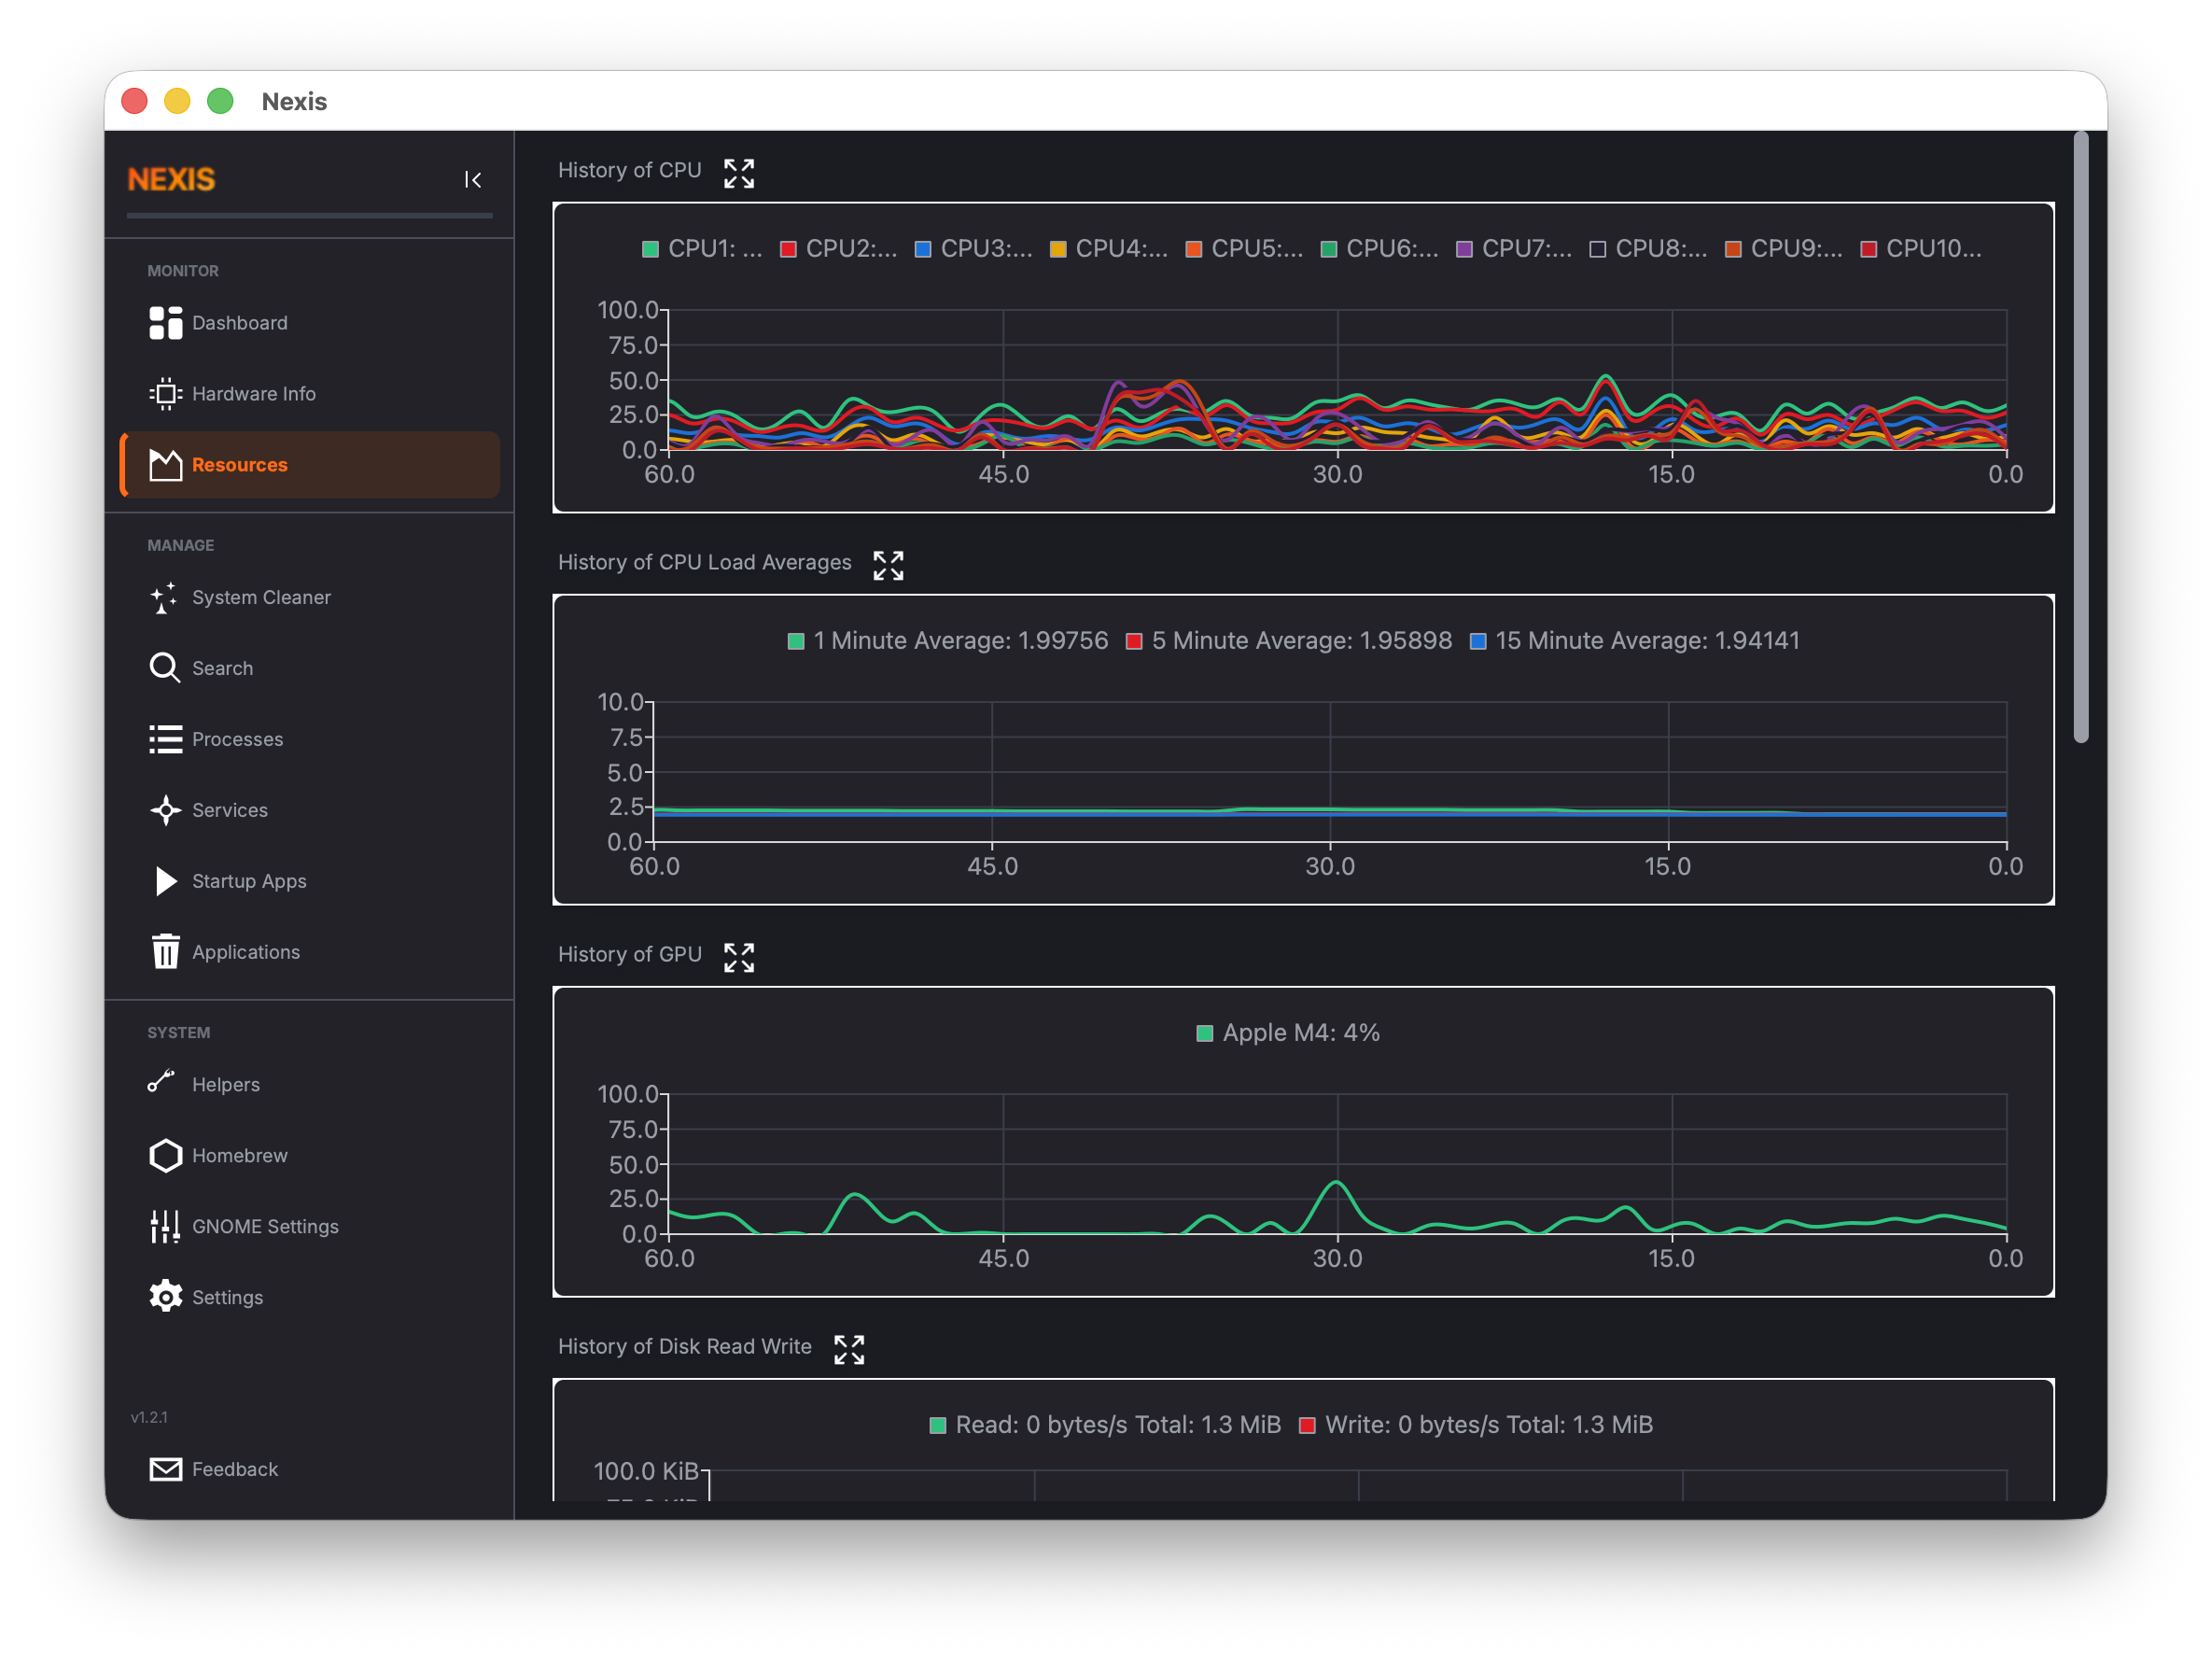
CPU Charts
Per-Core Utilization
A separate line for each logical CPU core, all overlaid on a single chart. This lets you see whether load is balanced evenly across cores or concentrated on just a few. A system compiling code might light up every core, while a poorly threaded application might pin a single core at 100% while the rest sit idle.
Load Averages (1 / 5 / 15 minute)
Three lines showing the classic Unix load average over one-minute, five-minute, and fifteen-minute windows. Load average represents the average number of processes waiting for CPU time. A value higher than your core count means the system is overloaded.
Tip: Comparing the 1-minute line to the 15-minute line tells you whether load is trending up (recent spike) or down (recovering from a past event).
GPU Utilization
If one or more GPUs are detected, a chart displays per-device utilization over time. Each GPU gets its own line. This is useful for monitoring machine learning workloads, video encoding, or games.
Linux: GPU data comes from sysfs for AMD and Intel GPUs, or from
nvidia-smifor NVIDIA cards. If you have an NVIDIA GPU and this chart shows 0%, make surenvidia-smiis installed and working.
macOS: GPU data is read through IOKit and Metal APIs.
Disk I/O
This chart tracks read and write throughput in bytes per second, with one line for reads and another for writes. The Y-axis scales dynamically to accommodate bursts — a large file copy will stretch the scale, and it shrinks back down when activity subsides.
Memory
The memory chart displays four data series to give you a detailed picture of how RAM is being used:
macOS: The four series are Wired (memory locked by the kernel), Active (recently used), Inactive (available for reclaim), and Compressed (memory compressed to save space). Watching Compressed climb while Active stays high means your system is under memory pressure.
Linux: The four series are Used, Available (free + reclaimable), Active (recently accessed), and Inactive (eligible for reclaim). If Available drops while Used climbs and swap starts growing, your workload is exceeding physical RAM.
Network
Download and upload throughput in bytes per second, charted as two separate lines. Useful for monitoring file transfers, streaming activity, or diagnosing network-intensive tasks.
Disk Temperature
A chart showing the temperature of each detected drive over time. Unlike the other charts, this one refreshes every 30 seconds rather than every second, because SMART temperature queries are heavier operations.
Tip: If you do not see a disk temperature chart, your drives may not support SMART temperature reporting, or
smartctlmay not be installed. See the Troubleshooting page for more details.
Disk Usage Launcher
At the bottom of the Resources page, a quick-launch card lets you open your preferred disk analyzer tool — a separate application that visualizes how disk space is used across your filesystem.
Click the launcher card to open the configured tool. You can change which tool is used in Settings > Disk Analyzer.
Available Tools
The list of available analyzers depends on your platform:
Linux: Baobab (GNOME Disk Usage Analyzer), Filelight, QDirStat, or ncdu.
macOS: GrandPerspective, DaisyDisk, or OmniDiskSweeper.
You can also specify a custom path to any disk analyzer application you prefer. Configure this in the Settings page.
What’s Next
Learn about the Hosts File Manager and other utility tools on the Helpers page.