Processes
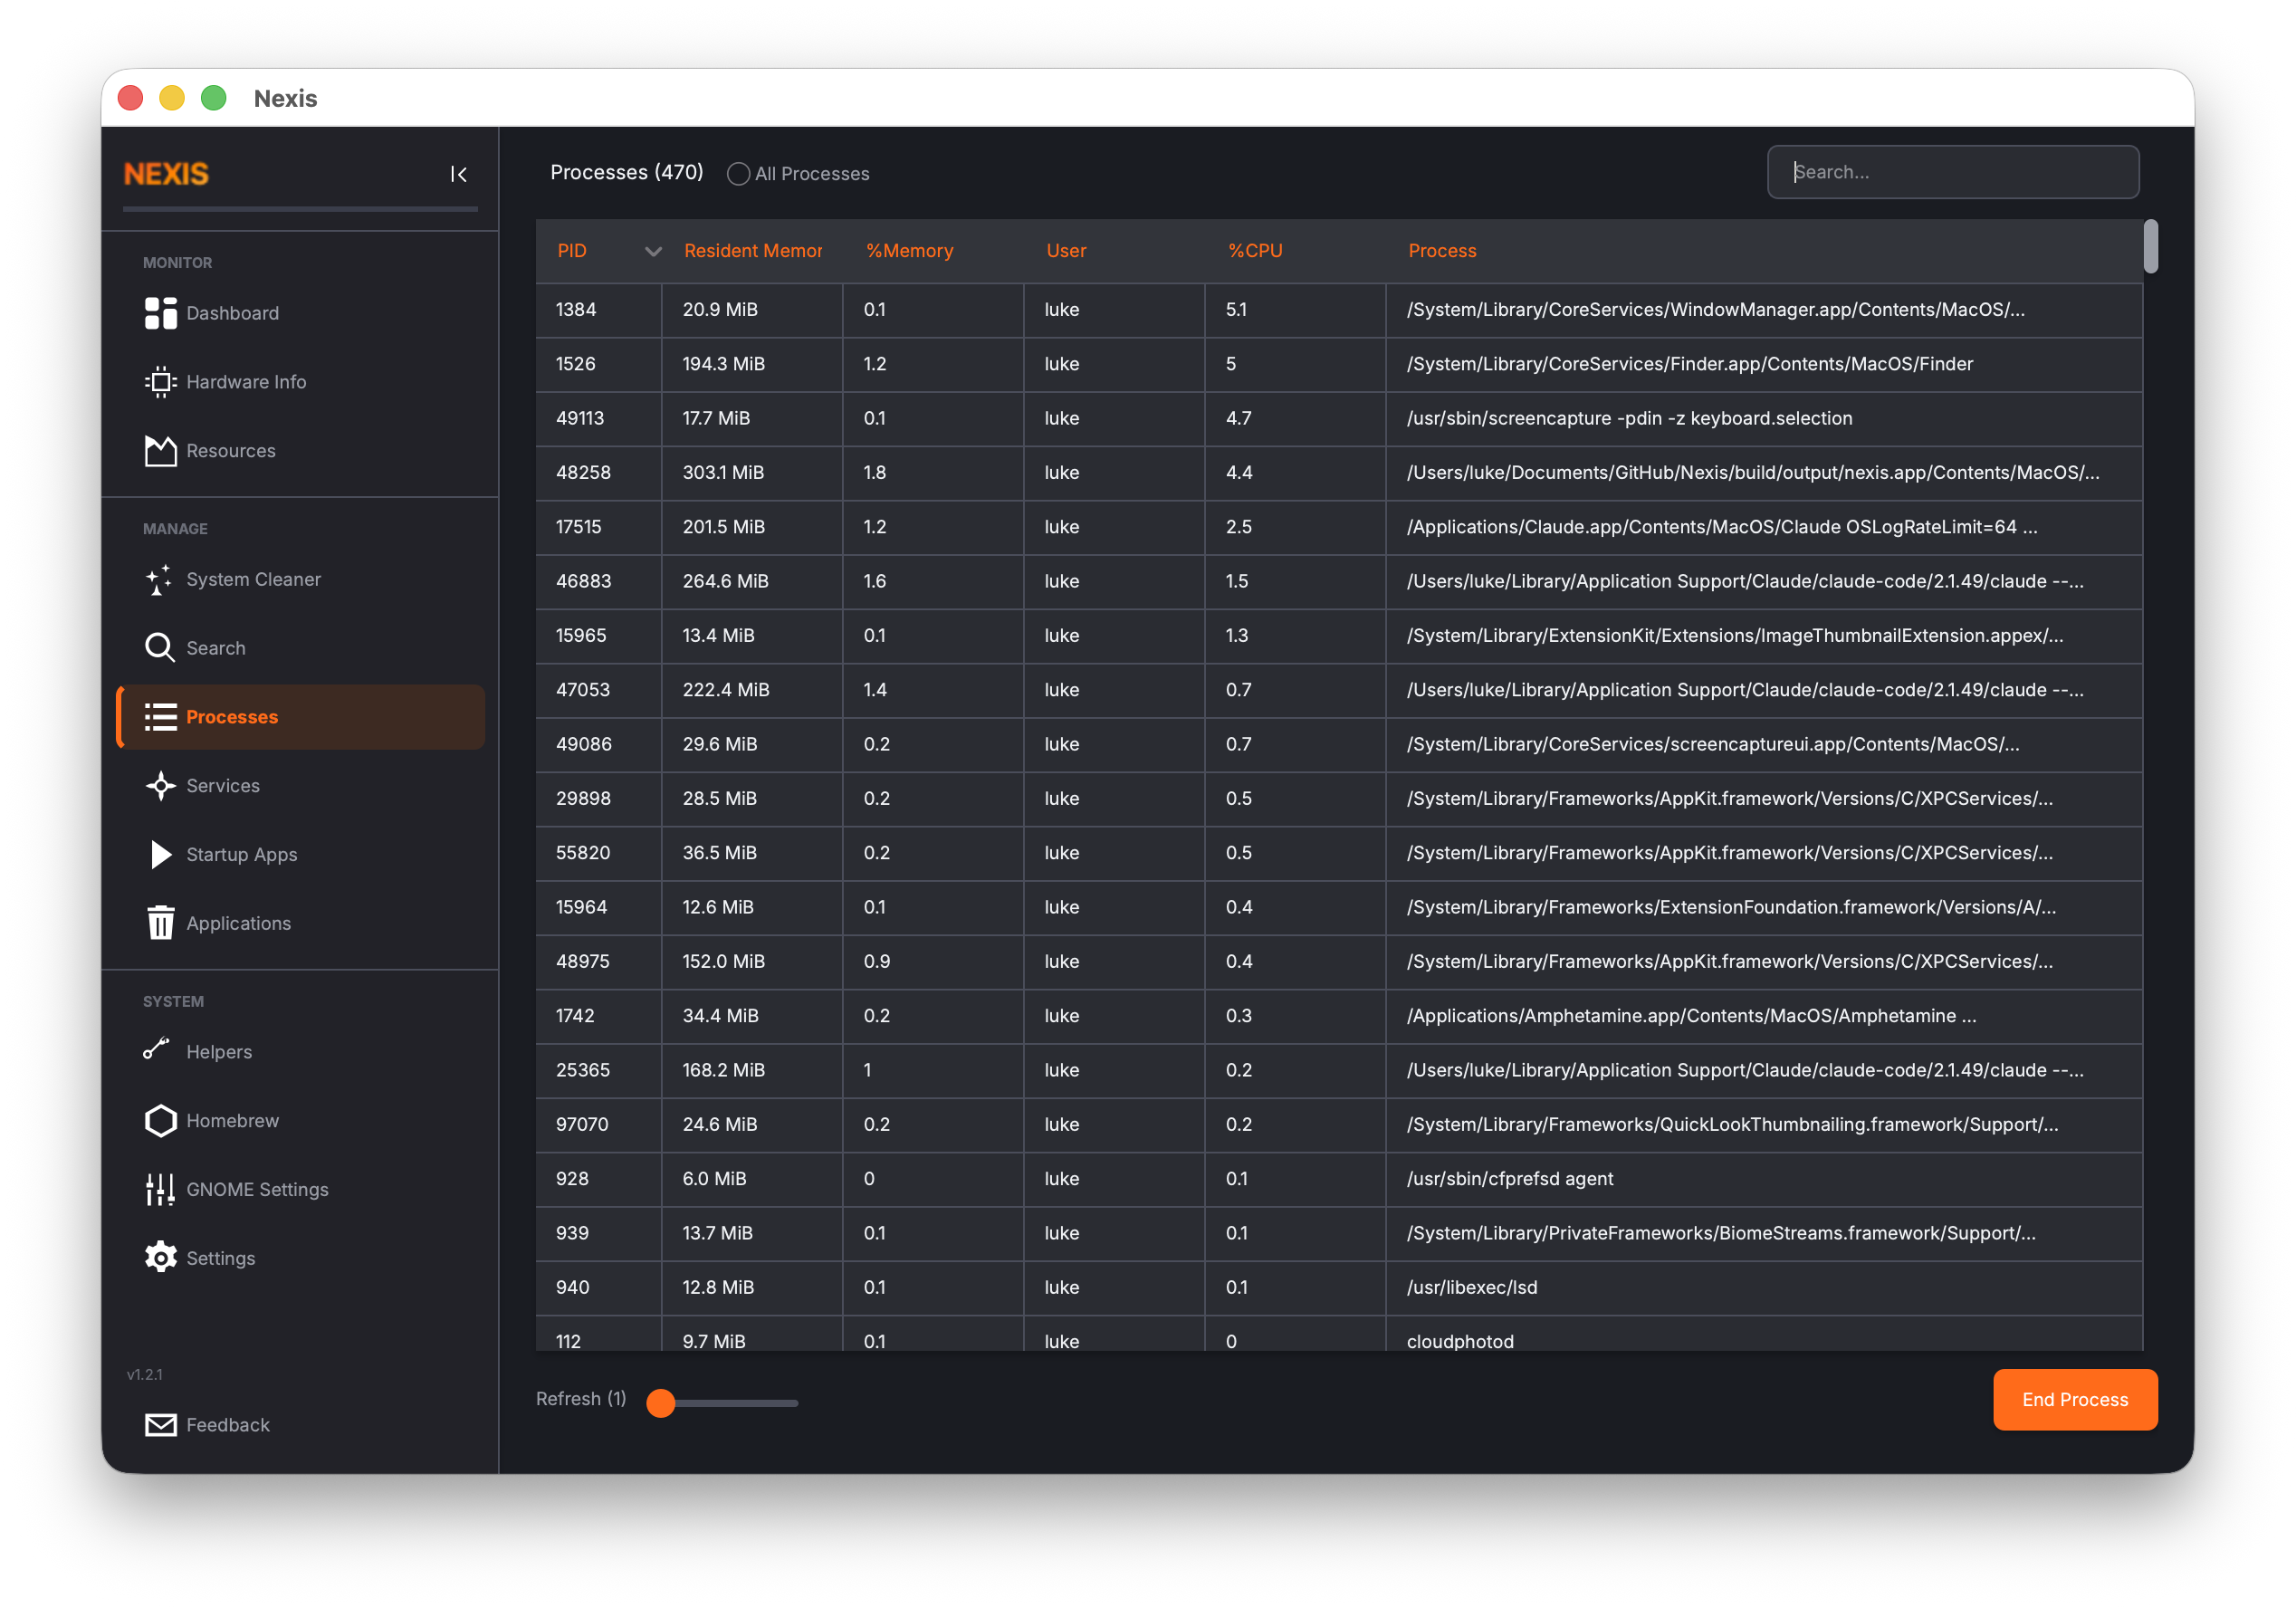
The Processes page is Nexis’s built-in task manager. It shows every running process on your system in a live-updating table, complete with CPU and memory usage. When something is hogging resources or has stopped responding, this is where you go to find and end it.
The Process Table
Each row in the table represents a running process. The default columns are:
| Column | Description |
|---|---|
| PID | Process ID — a unique number assigned by the operating system |
| Name | The process name (usually the executable file name) |
| User | The user account that owns the process |
| CPU % | Current CPU usage as a percentage of one core |
| Memory % | Current memory usage as a percentage of total RAM |
| Disk Read | Disk read rate in bytes per second for this process |
| Disk Write | Disk write rate in bytes per second for this process |
| Net Down | Network download rate for this process |
| Net Up | Network upload rate for this process |
| Command | The full command line that started the process |
The Disk I/O columns show delta-based rates — the difference in cumulative bytes between refresh intervals — so you see the current activity rather than lifetime totals.
macOS: All columns are fully supported. Disk I/O is read via
proc_pid_rusage()and network data vianettop.
Linux: Disk I/O is read from
/proc/<pid>/io. Network columns show N/A because Linux lacks a non-privileged API for per-process network attribution.
Sorting
Click any column header to sort the table by that column. Click the same header again to reverse the sort order.
Sorting by CPU % (descending) puts the most CPU-hungry processes at the top — the quickest way to find out why your fans are spinning. Sorting by Memory % does the same for RAM usage. You can also sort by Disk Read or Disk Write to find processes generating heavy I/O, or by Net Down / Net Up to find network-intensive processes.
Searching
The search bar at the top filters the table in real time as you type. You can search by process name, PID, user, or any part of the command line. This is the fastest way to find a specific process when you already know what you are looking for.
Adjusting the Refresh Rate
The process table updates on a configurable timer. Use the refresh rate slider to set the interval anywhere from 1 second (maximum detail, higher CPU cost) to 10 seconds (lighter on resources, less frequent updates).
- 1-2 seconds is good for active debugging when you need to watch values change in near real time.
- 5-10 seconds is fine for casual monitoring.
Tip: A faster refresh rate means Nexis queries the process list more often, which itself uses a small amount of CPU. If you are investigating a performance issue, be aware of this overhead and choose a balance that works for you.
Ending a Process
Select a process from the table and click the End Process button to terminate it. This sends a termination signal to the process, asking it to shut down.
- If you own the process (it is running under your user account), it will be terminated immediately.
- If the process belongs to another user (including root/system processes), Nexis will prompt for your administrator password.
Tip: Ending a process is not the same as closing an application gracefully. If the program has unsaved data, it may be lost. Try closing the application normally first and use “End Process” only when it is unresponsive.
Right-Click Context Menu
Right-click any row in the process table to access additional options:
- Copy PID — Copies the process ID to your clipboard, useful for pasting into terminal commands
Customizing Visible Columns
Not all columns may be relevant to your workflow. Right-click on the column header row to open a menu that lets you toggle which columns are visible. For example, you might hide the “Command” column if you only care about the process name and resource usage.
Your column visibility choices help keep the table focused on the information you care about most.
Common Use Cases
Finding What Is Using All Your CPU
Sort by CPU % in descending order. The top entries are your biggest consumers. If you see a process using 100% or more and you do not expect it, it might be stuck in a loop or performing an unexpectedly intensive task.
Finding What Is Using All Your Memory
Sort by Memory % in descending order. Browsers, IDEs, and container runtimes are common culprits. If a process’s memory usage keeps climbing over time without leveling off, it may have a memory leak.
Killing a Frozen Application
Search for the application name, select it, and click End Process. If the process does not disappear within a few seconds, it may be stuck in an uninterruptible state — in that case, you may need to use a terminal for a force kill.
What’s Next
Learn how to remove installed applications and packages in the Uninstaller guide.