Hardware Info
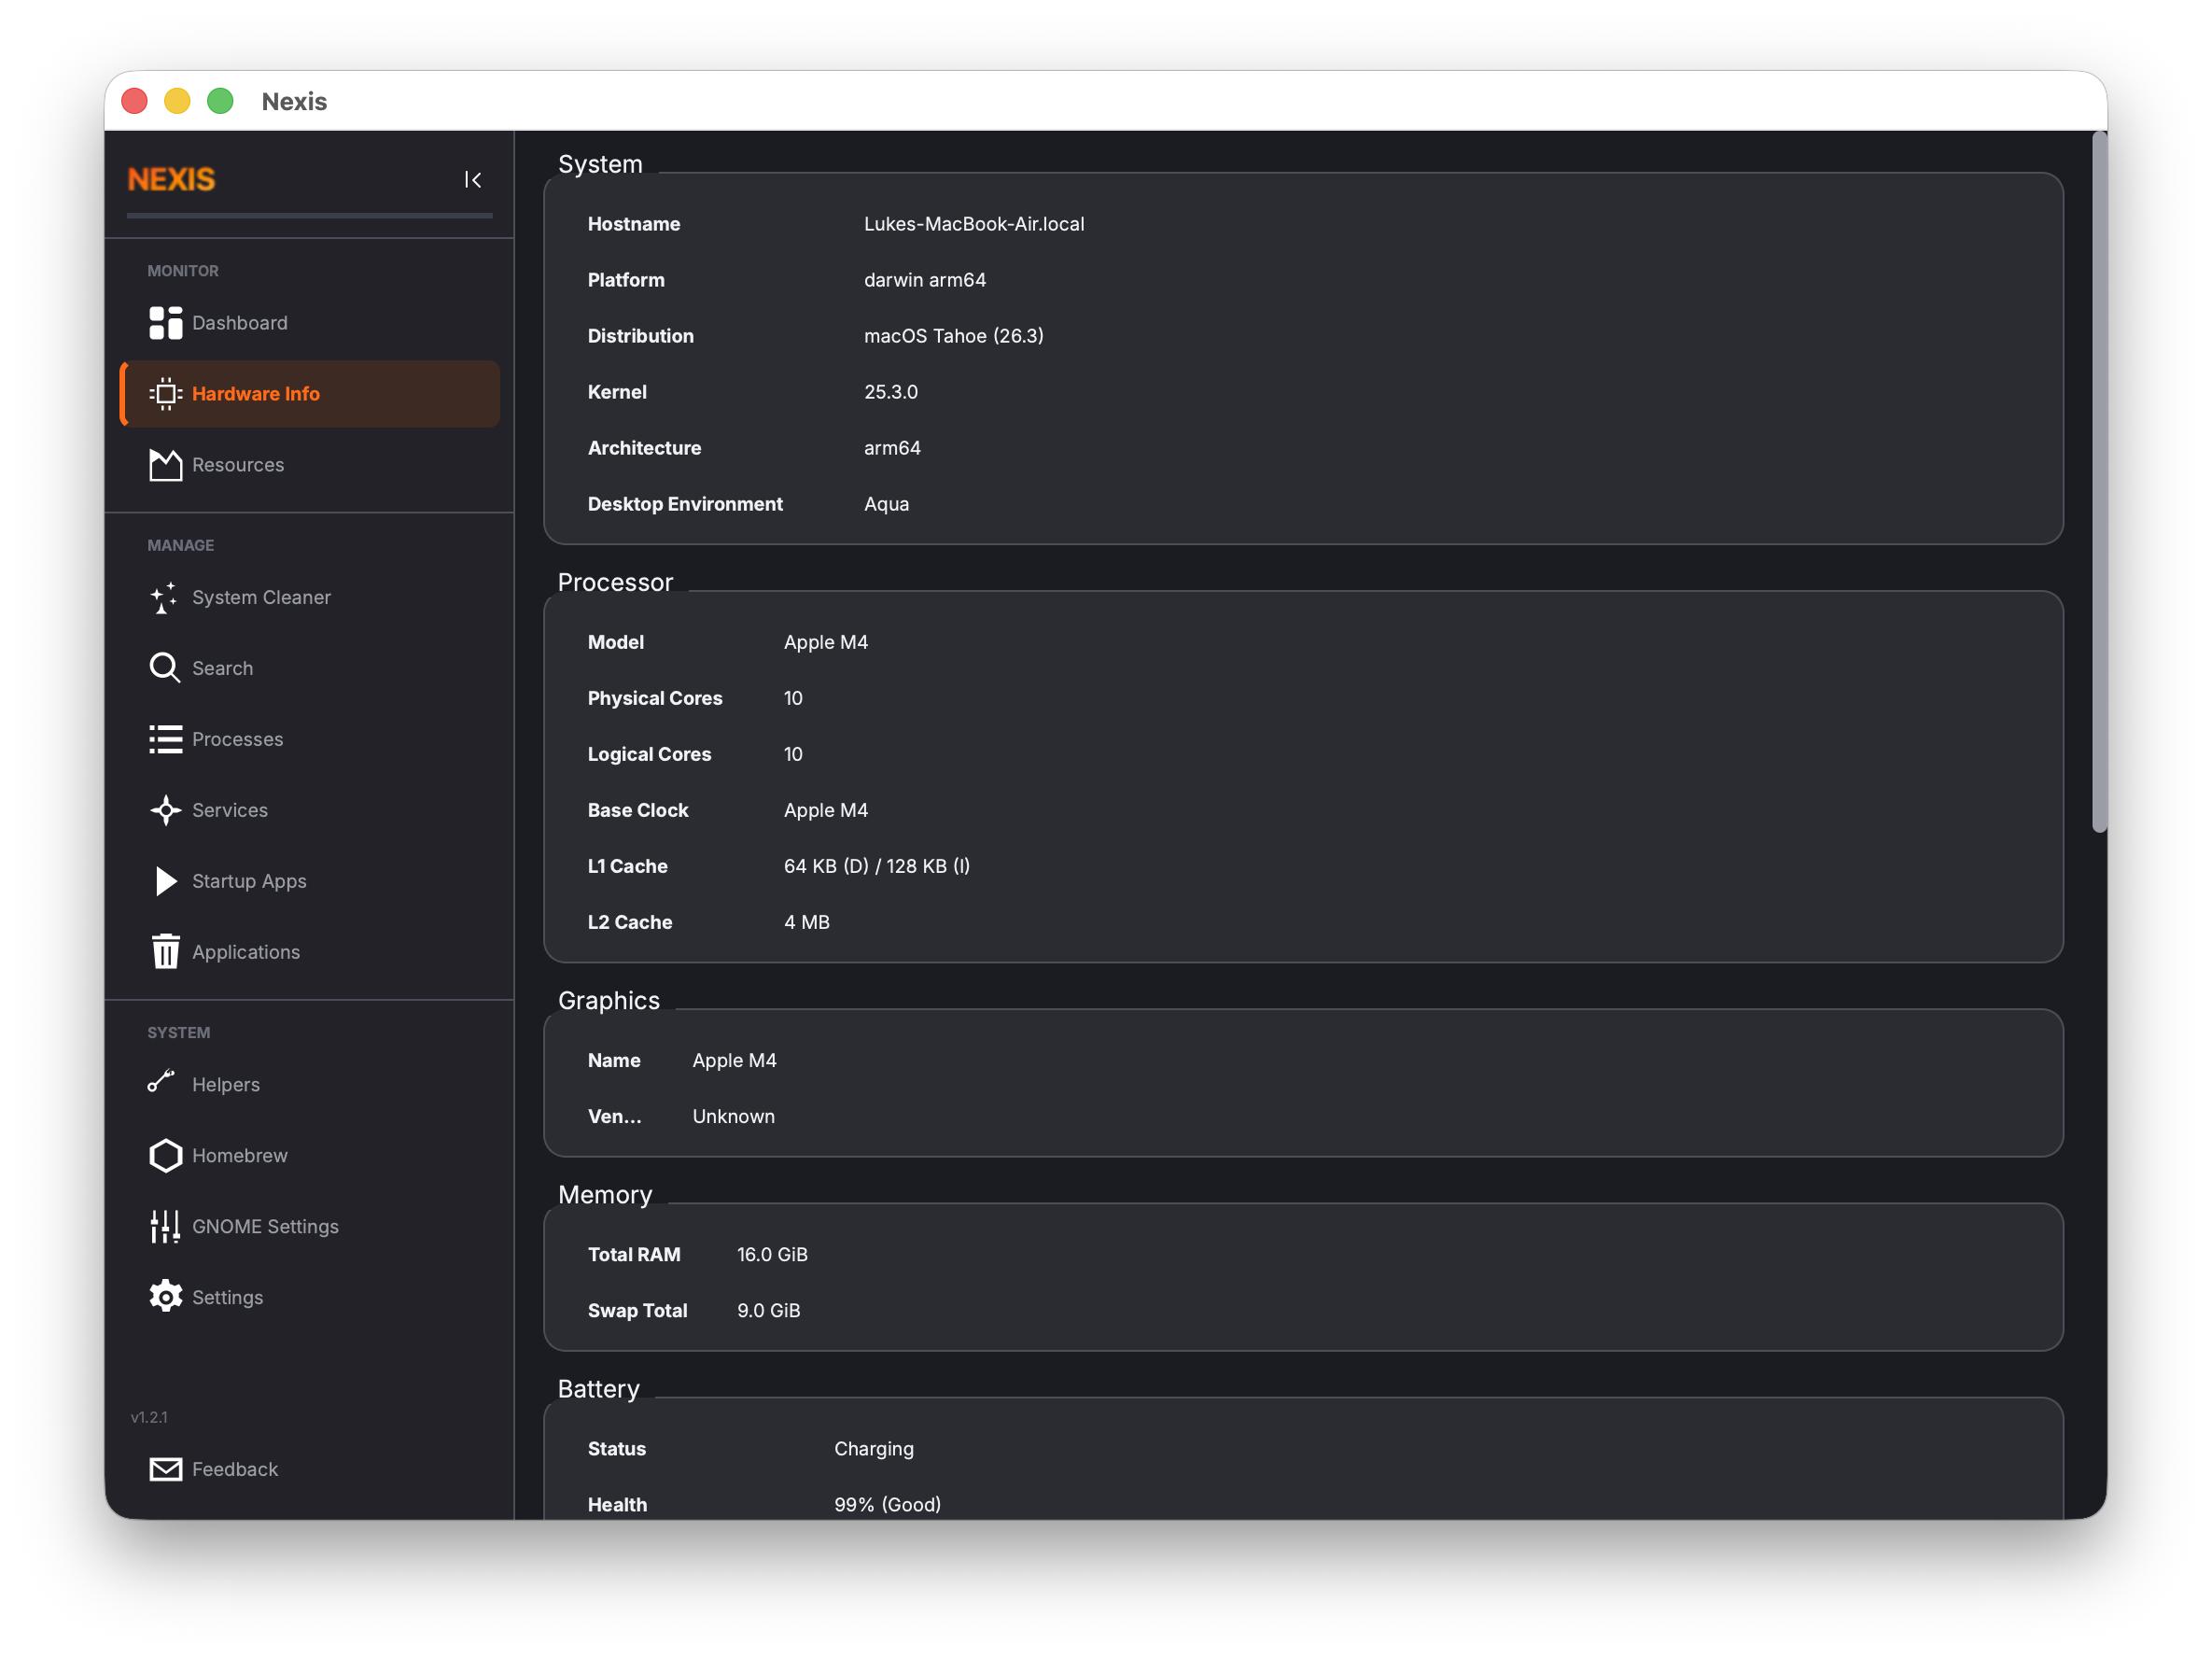
The Hardware Info page gives you a comprehensive, read-only inventory of your system’s components. Unlike the Dashboard (which focuses on live utilization), this page shows static specifications — model names, capacities, core counts, and health ratings that do not change from second to second.
All data is collected once when you first visit the page, so there is no ongoing performance cost.
Sections
The page is divided into eight collapsible sections. Each one is a table of key-value pairs relevant to that hardware category.
System
General information about your machine and operating system.
| Field | Description |
|---|---|
| Hostname | Your computer’s network name |
| Operating System | Distribution or macOS version |
| Kernel | Linux kernel version or Darwin/XNU version |
| Architecture | CPU architecture (x86_64, arm64, etc.) |
| Desktop Environment | GNOME, KDE, Aqua, etc. |
Processor
Details about your CPU.
| Field | Description |
|---|---|
| Model Name | Full marketing name of the processor |
| Physical Cores | Number of physical CPU cores |
| Logical Cores | Number of threads (includes hyper-threading) |
| Base Clock | Default clock speed |
| L1 / L2 / L3 Cache | Size of each cache level |
Graphics
Your GPU(s) and their vendors.
| Field | Description |
|---|---|
| GPU Name | Model name of each graphics processor |
| Vendor | Manufacturer (NVIDIA, AMD, Intel, Apple) |
Linux: Detected via sysfs for AMD and Intel,
nvidia-smifor NVIDIA cards.
macOS: Detected via IOKit and Metal APIs.
Memory
System memory totals.
| Field | Description |
|---|---|
| Total RAM | Installed physical memory |
| Total Swap | Configured swap space |
Battery
Shown only on devices with a battery.
| Field | Description |
|---|---|
| Design Capacity | Original factory capacity |
| Current Max Capacity | Maximum charge the battery can currently hold |
| Cycle Count | Number of full charge-discharge cycles |
| Health | Percentage of original capacity remaining |
Storage
One row per detected drive, with SMART health data.
| Field | Description |
|---|---|
| Name | Drive identifier or mount point |
| Size | Total capacity |
| Model | Drive model string |
| Health | SMART health verdict with color coding |
Health Color Coding
The health verdict uses a simple traffic-light system:
- Good (green) — The drive is healthy. No action needed.
- Caution (yellow) — Some SMART attributes are degrading. Consider backing up and monitoring closely.
- Critical (red) — The drive is reporting failures. Back up your data immediately and plan a replacement.
Tip: Storage health is determined by reading SMART attributes via
smartctl. On macOS, Nexis also usesdiskutilfor additional metadata. Ifsmartctlis not installed, health data may be unavailable.
Network
One row per network interface.
| Field | Description |
|---|---|
| Interface | Name of the network adapter (e.g., eth0, en0, wlan0) |
| MAC Address | Hardware address |
| IP Addresses | IPv4 and/or IPv6 addresses assigned to the interface |
Thermal
Sensor readings from available temperature probes.
| Field | Description |
|---|---|
| Sensor | Name or label of the thermal sensor |
| Temperature | Current reading |
Linux: Reads from
/sys/class/hwmon/entries.
macOS: Reads from the System Management Controller (SMC).
Export System Report
Click the Export button at the top of the page to save a complete text summary of all hardware information to a file. A save dialog appears with a default filename of nexis-report-YYYY-MM-DD.txt.
The report includes every section visible on the page — System, Processor, Graphics, Memory, Battery, Fans, and Storage — formatted as labeled key-value pairs. The report also contains the Nexis version number and a timestamp. This is useful for:
- Sharing specs when asking for technical support or posting to forums.
- Archiving your hardware configuration before and after upgrades.
- Comparing multiple machines side by side.
What’s Next
Learn how to control which apps launch at login in the Startup Apps guide.