Dashboard
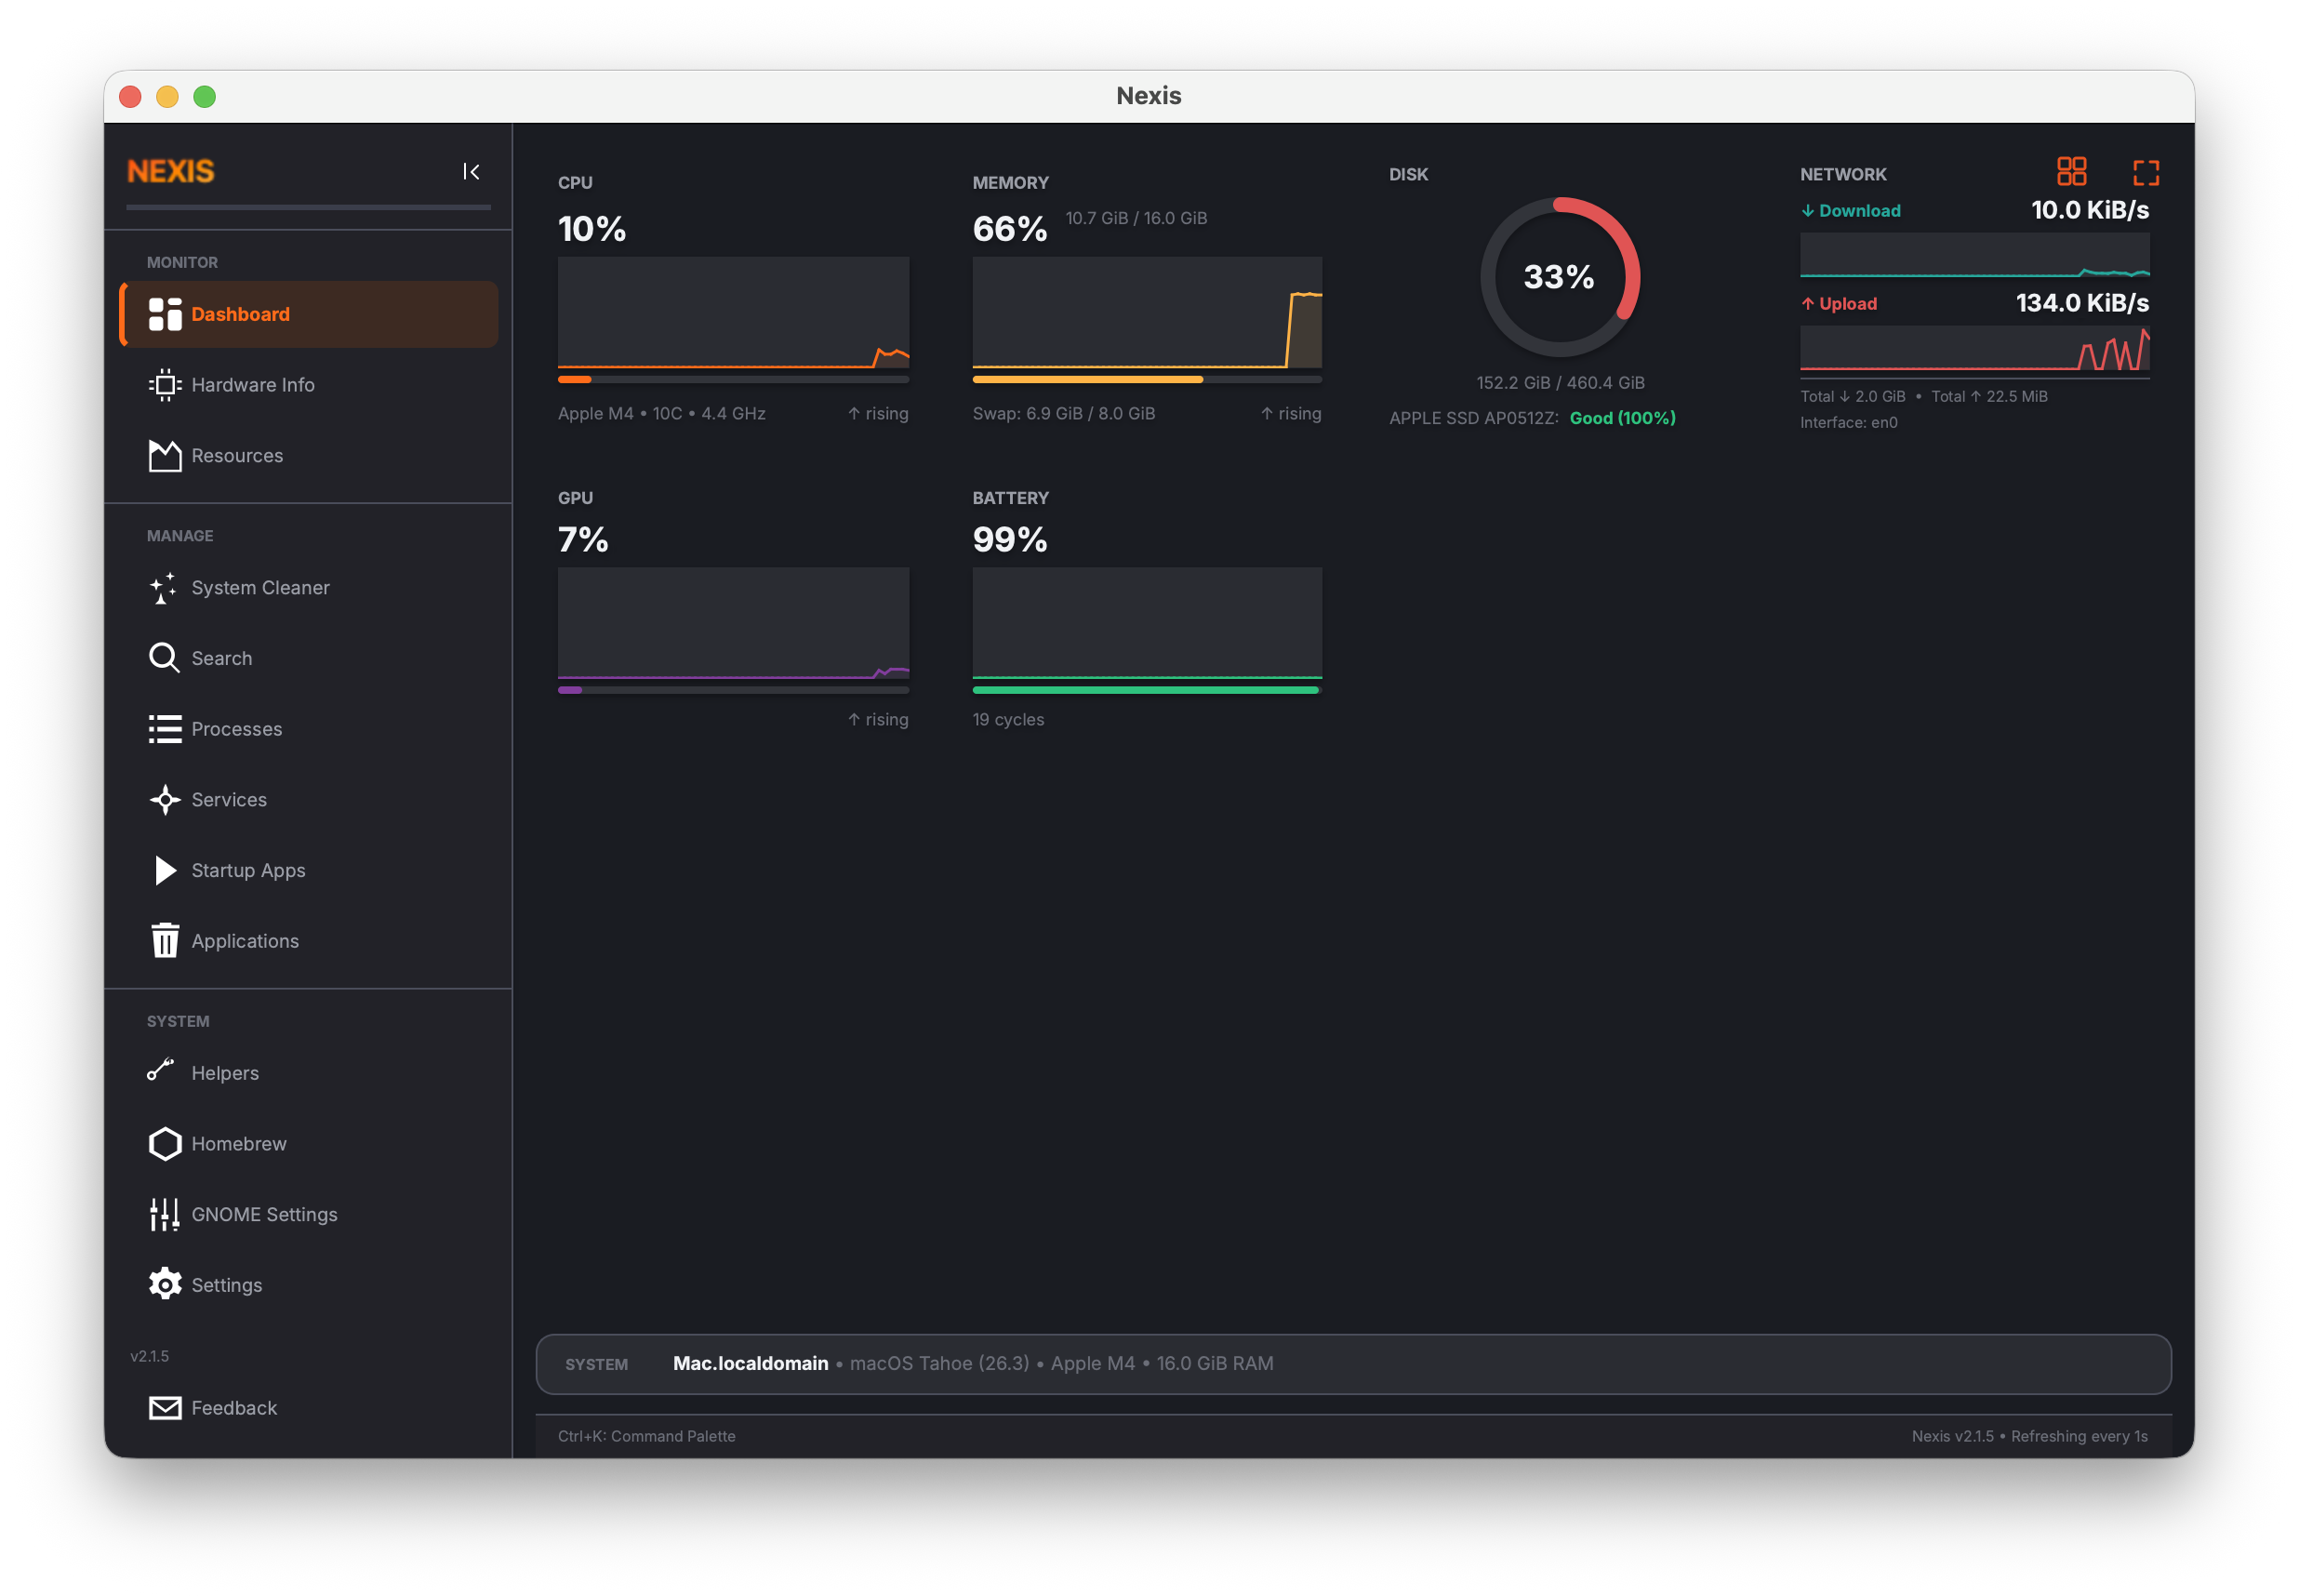
The Dashboard is the first thing you see when Nexis launches. It presents a bento grid of live-updating tiles that summarize the health and activity of your system at a glance. Every metric refreshes automatically — most once per second — so you always have a current picture without needing to click anything.
The layout, tile styles, colors, and sizes are all fully customizable through Edit Mode.
Tiles
CPU
Displays overall CPU usage as a percentage with a history visualization. The subtitle shows the CPU model, core count, and current clock speed.
Memory
Shows memory usage as a percentage along with the used/total breakdown.
On macOS, the subtitle shows a breakdown of Wired, Active, and Compressed memory. The tile’s accent color changes based on memory pressure: green when pressure is normal, yellow when elevated, and red when critical — giving you an instant visual cue about whether your system needs more RAM.
On Linux, the subtitle shows Available memory and swap usage. Memory pressure is derived from PSI (Pressure Stall Information) when available, with a heuristic fallback on older kernels.
Disk
Features a donut chart that fills proportionally to your disk usage. Inside the ring you will see the used and total capacity. Below the chart, a health badge reports the drive’s SMART verdict (e.g., “Good (92%)”).
Tip: If your machine has more than one disk, a small gear icon appears in the top-right corner of the tile. Click it to open a dropdown menu and switch which drive is displayed. Your selection is remembered across sessions.
Network
Shows two sparkline charts stacked vertically — one for Download speed and one for Upload speed. Below the charts you will find cumulative totals and the active network interface name.
GPU (conditional)
Shows the current GPU utilization as a percentage with a history visualization. Only appears when a discrete GPU is detected. If your system has multiple GPUs, a selector lets you choose which one to monitor.
Temperature (conditional)
Displays the reading from a selected thermal sensor. When two or more sensors are detected, a gear icon menu appears so you can pick which sensor to track.
Fans (conditional)
Displays fan speed in RPM with a percentage gauge based on the fan’s maximum rated speed. Only appears when your system has detectable fans. If multiple fans are present, a gear icon menu lets you choose which fan to monitor.
Note: Fanless machines (such as passively cooled MacBooks) hide this tile automatically.
Battery (conditional)
Shows battery health as a percentage with cycle count. Only appears on laptops and other battery-powered devices.
Health Score
A composite 0–100 health score that aggregates multiple system metrics into a single number: CPU load, memory pressure, disk space, drive temperature, battery cycle health, and SMART disk health. The score gives you a quick overall verdict on your system’s condition.
When displayed at a larger size (2×1 or 2×2), the tile shows breakdown bars for each contributing factor so you can see which areas are dragging the score down.
Tip: A score above 80 generally means your system is in good shape. If the score drops, check the breakdown bars to identify the specific factor — low disk space and high memory pressure are the most common culprits.
Linux: GPU data comes from sysfs (AMD/Intel) or
nvidia-smi(NVIDIA). Temperature and fan data comes from/sys/class/hwmon/.
macOS: GPU info is read through IOKit and Metal. Temperature and fan data comes from the System Management Controller (SMC).
Edit Mode
Press Ctrl+E or click the grid icon in the top-right corner to enter Edit Mode. A toolbar appears at the top with a Reset Layout button and a Done button.
While in Edit Mode you can:
Drag & Drop
Click and drag any tile to swap its position with another tile, or move it into an empty grid cell.
Resize
Drag the triangle grip in the bottom-right corner of a tile to resize it. Tiles support 1×1, 1×2, 2×1, and 2×2 grid cell sizes. Larger tiles automatically switch to a bigger display mode with more detail.
Change Tile Style
Click the paintbrush icon on any tile to open the style menu. The menu has two sections:
Style — Choose a visual style for the tile:
| Style | Description |
|---|---|
| Sparkline | Line chart showing recent history (default for most tiles) |
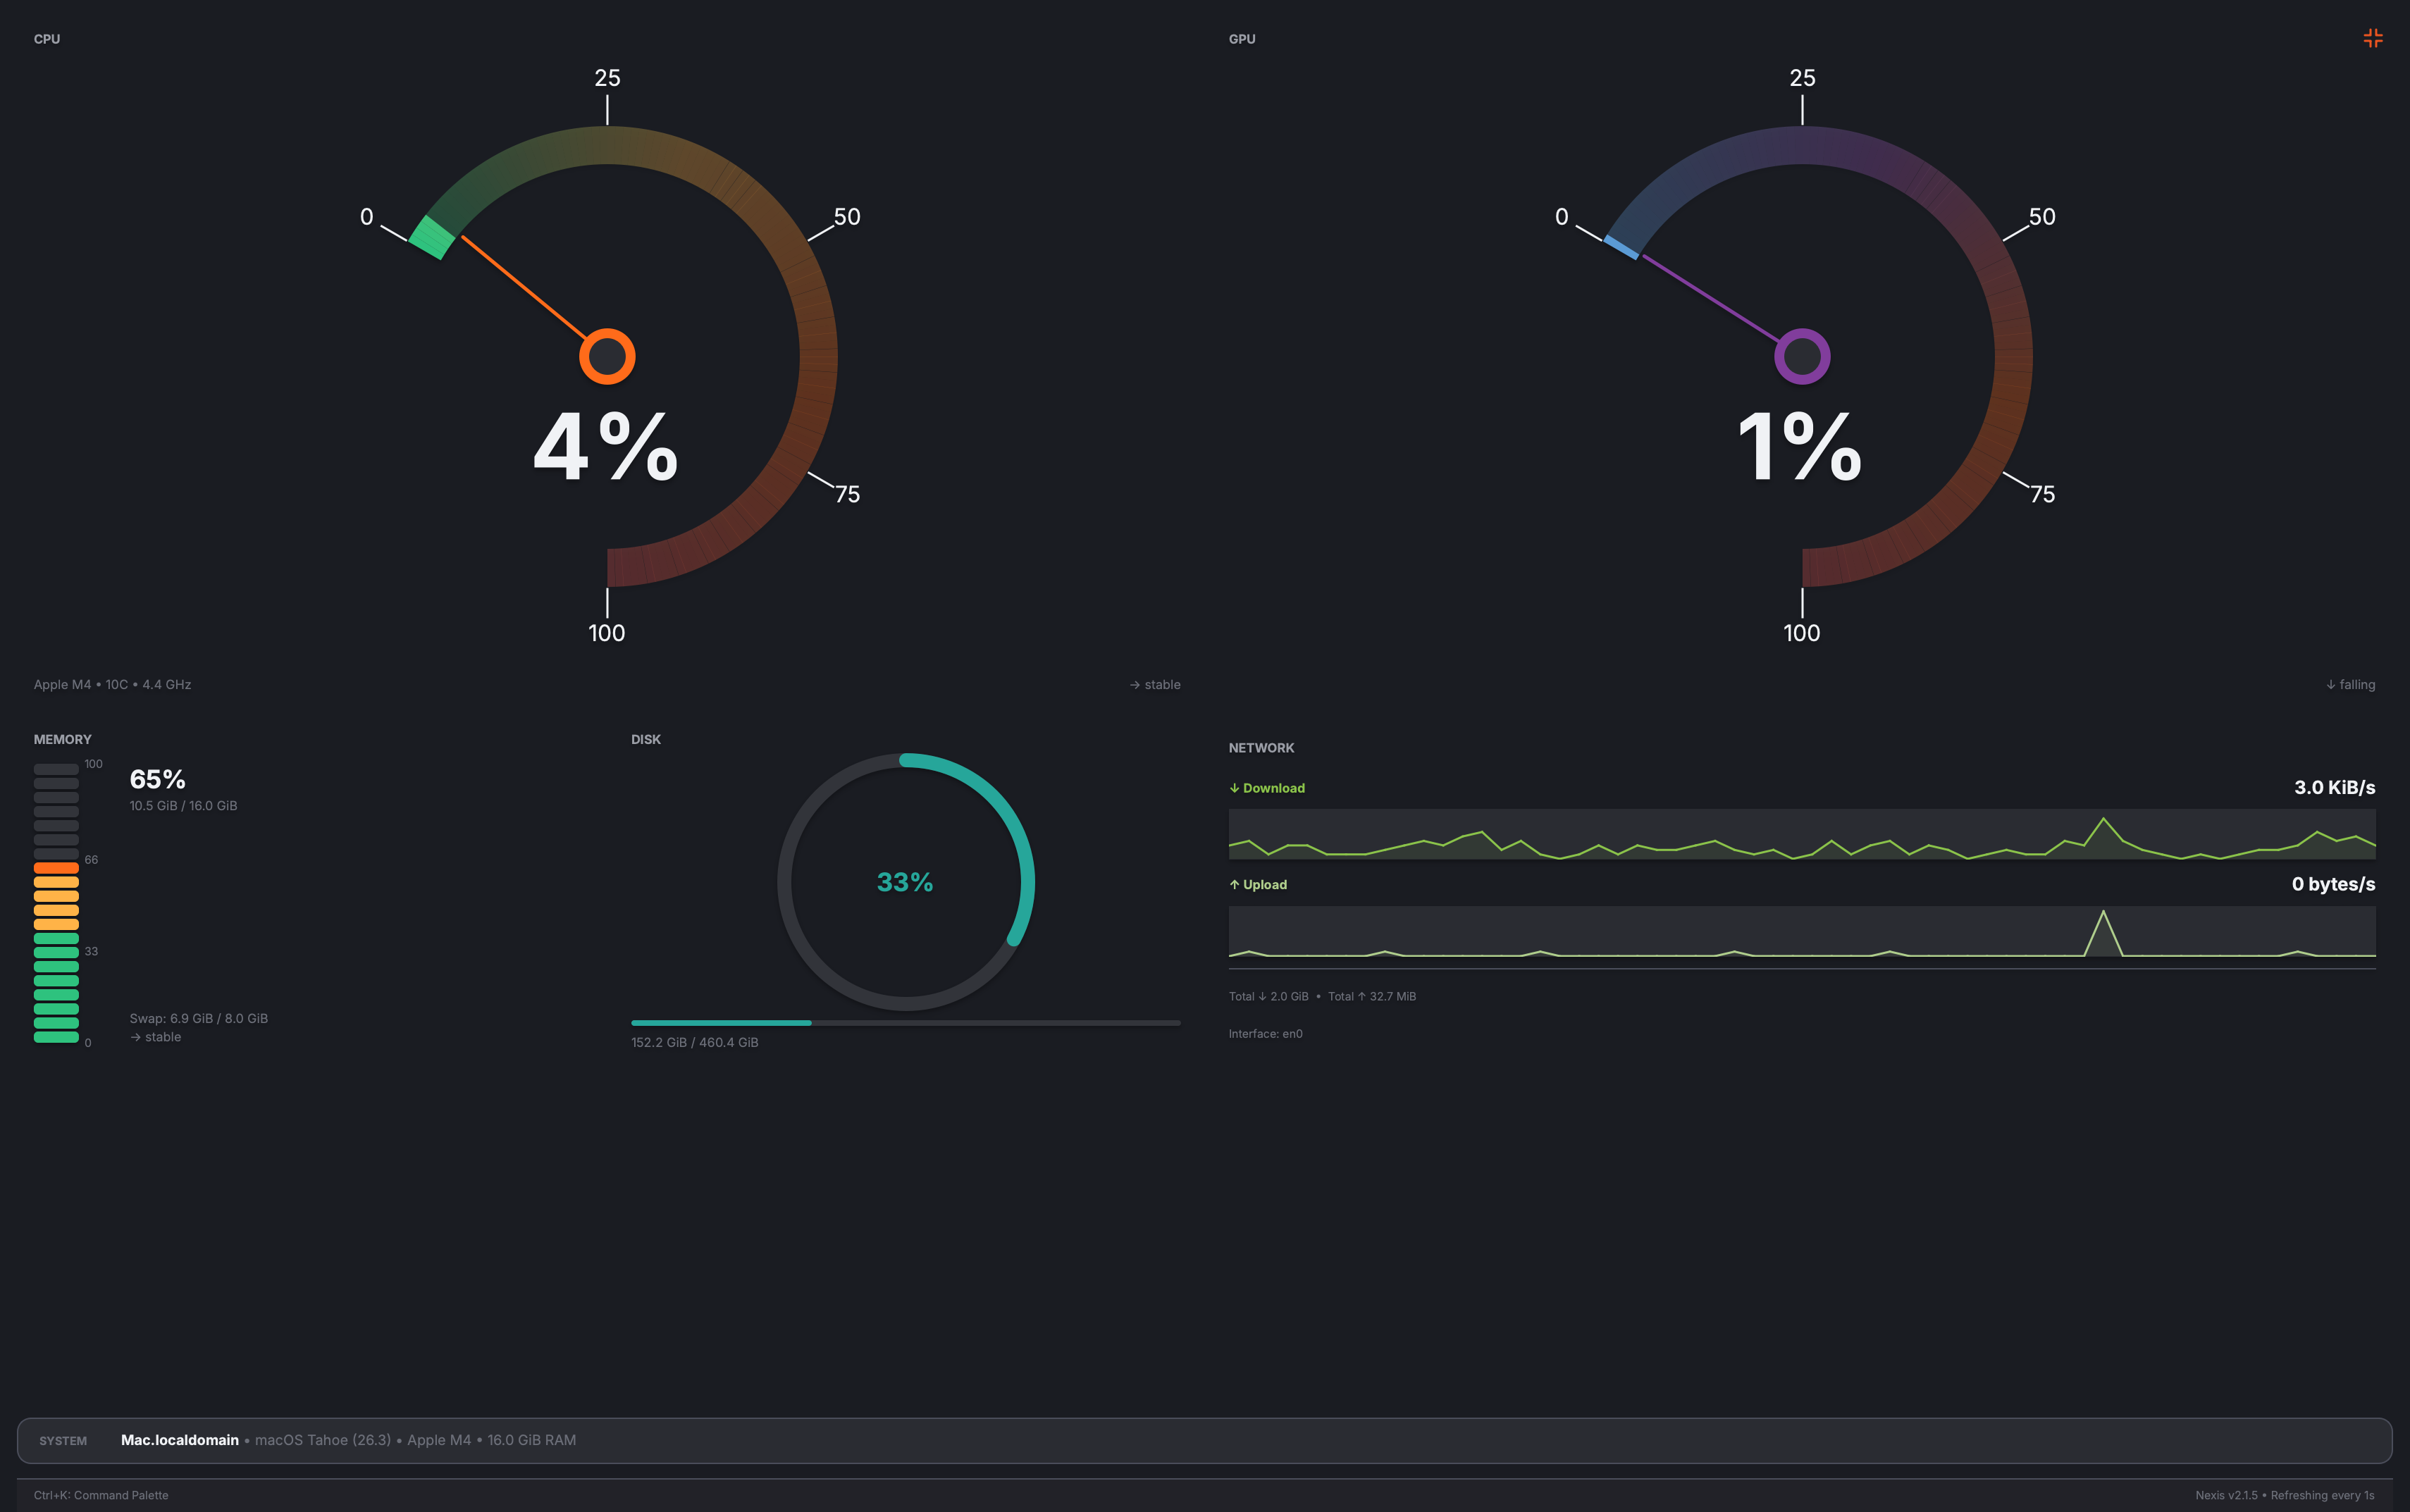
| Gauge | Circular arc that fills based on the current value |
| Ring | Full circular ring with percentage |
| Hybrid | Arc gauge combined with a sparkline history |
| Speedometer | Dial gauge with a color-graded arc and needle |
| VuMeter | Vertical segmented bar with color-graded segments |
| Donut | Ring chart with used/total text inside (default for Disk) |
Note: The Network tile has a fixed dual-sparkline style and does not support style switching.
Color or Color Range — Customize the tile’s colors:
-
For most styles (Sparkline, Gauge, Ring, Hybrid, Donut), a Color section appears with 16 preset color swatches plus a Default option to revert to the theme color. Selecting a swatch immediately recolors the tile’s accent elements.
-
For Speedometer and VuMeter styles, a Color Range section appears instead. These styles use multi-color gradients to indicate severity, so instead of a single color you choose a direction preset:
| Preset | Direction | Use Case |
|---|---|---|
| Green → Red | Low=green, High=red | ”High is bad” — CPU, Memory, Disk usage |
| Red → Green | Low=red, High=green | ”High is good” — Battery health |
| Blue → Red | Low=blue, High=red | Cool-to-hot — Temperature |
| Teal → Orange | Low=teal, High=orange | Neutral alternative |
Tip: Choose the range direction based on what the metric means. For example, CPU usage is “high is bad” so Green → Red makes sense — the arc turns red as usage climbs. Battery health is “high is good” so Red → Green is more intuitive — the arc is green when health is high.
- For the Network tile, selecting a color recolors both the Download and Upload sparklines. The upload sparkline uses a lighter shade of the chosen color to remain visually distinct.
Remove Tiles
Click the orange X button on any tile to hide it from the dashboard. Hidden tiles are excluded from the grid layout.
Reset Layout
Click Reset Layout in the toolbar to restore all tiles to their default positions, styles, colors, and visibility. This undoes all customizations.
Saving
All layout changes — tile positions, sizes, styles, colors, ranges, and visibility — are automatically saved and persist across sessions. When you click Done or exit edit mode, the layout is written to your settings file.
System Summary Bar
A full-width bar below the tiles shows a compact, single-line summary of your system: hostname in bold, followed by your OS name, CPU model, and total RAM. This gives you a quick identity check, especially useful if you manage multiple machines.
Footer Status Bar
At the very bottom of the Dashboard, a small status bar displays the current Nexis version and the data refresh interval.
Kiosk Mode
Kiosk mode turns Nexis into a fullscreen monitoring display by hiding the sidebar, title bar, and window chrome. This is ideal for a dedicated monitoring screen, a wall-mounted display, or simply when you want a distraction-free view.
There are three ways to enter and exit kiosk mode:
| Method | Enter | Exit |
|---|---|---|
| Keyboard | F11 | F11 or ESC |
| System tray | Right-click tray icon, check “Kiosk Mode (F11)“ | Uncheck the same menu item |
| Dashboard button | Click the fullscreen icon in the top-right corner | Click the collapse icon that replaces it |
When you activate kiosk mode, a brief overlay message (“Press ESC to exit kiosk mode”) fades in and then disappears after a few seconds. Your kiosk mode preference is saved, so if you quit and relaunch Nexis, it returns to kiosk mode automatically.
Tip: Kiosk mode keeps the data refresh timers running even when the window would normally be considered “minimized.” This ensures the Dashboard stays up to date on a dedicated display.
Note: Edit mode and kiosk mode are mutually exclusive — entering one exits the other.
Update Checker
Nexis periodically checks GitHub for new releases. If a newer version is available, a notification bar appears on the Dashboard so you know when it is time to upgrade.
What’s Next
To dive deeper into the hardware details behind the Dashboard numbers, see the Hardware Info guide.